Monday, 7 October 2013

A Deeper Look at Student Achievement: Kansas, Texas and the U.S.

Wichita blogger Bob Weeks has an interesting post and video that makes several points about evaluating educational performance.  First, it is important to consider characteristics of the student population which can have an impact on results.  Second, it is important to consider as much data as possible to see the full picture.


Mr. Weeks reviews the results of the 2011 National Assessment of Educational Progress for Kansas and Texas.  The NAEP tests a sampling of students in each state at grades four and eight in reading and math every two years.  Overall, Kansas students score higher on the NAEP than those in Texas.  Kansas spends more per pupil than Texas, and KASB has compiled evidence that both nationally and regionally, states with the best achievement on a variety to educational achievement factors tend to spend more per pupil than states with lower achievement.


However, Mr. Weeks points out that Texas actually has higher “scale scores” than Kansas for racial or ethnic “subgroups” on most tests. Like Kansas and other states, Texas has a “significant achievement gap” among these groups, with non-white students usually performing at lower levels than white students.


“In Kansas, 69 percent of students are white,” he writes.  “In Texas it’s 33 percent. This large difference in the composition of students is what makes it look like Kansas students perform better on the NAEP than Texas students.  But looking at the scores for ethnic subgroups, which state would you say has the most desirable set of NAEP scores?”


These results raise important questions about student achievement.  Texas spends less per pupil than Kansas - but Kansas also spends less than the national average. We wanted to dig deeper into student characteristics and educational outcomes in comparing Kansas and Texas to each other and the nation as a whole.


Factors OUTSIDE of school have a big impact on achievement IN school


To begin with, KASB absolutely agrees that differences in student characteristics must be considered in evaluating educational performance.  I made exactly the same point in my August 14, 2013 blog post "Celebrating Back to School Success" when I noted that student performance for all student subgroups, especially minority students, has been growing faster than the overall average, because minority students compose a growing portion of the U.S. and Kansas population.  When critics says student performance hasn’t improved very much, they rarely note that overall performance would be much higher if the student population was the same as in 1970, 1985 or even 2000.


However, the most important factor in student performance isn’t race or ethnicity, but socio-economic status.  As a group, lower-income students, usually measured by eligibility for free or reduced lunch, have much lower performance than middle- and upper-income students.  Non-white students also tend to lag behind - because they are more likely to be from low income families.


Studies have shown for decades that lower income students lag behind their peers.  There are many reasons.  Lower income parents tend to have lower education levels themselves, and may provide less academic support at home.  Low income children are exposed to a much smaller vocabulary.  Low income students are more at-risk for deficiencies in basic needs, like food, health care and even shelter.  Parents in lower income families are more likely to be absent, neglectful, substance abusers or incarcerated.  Children in these circumstances simply face more distractions from academics than more affluent children from stable homes and better educated parents who promote education.


These factors have nothing to do with race.  Economically advantaged minority students can be just as successful as white students. Likewise, lower-income white students also struggle academically.


While Kansas and Texas students are considerably different in racial make-up, they are surprisingly similar in terms of socioeconomic status. As noted above, 68 percent of Kansas students were white in 2010-11, compared to just 31.2 percent of Texas students.  However, 47.7 percent of Kansas students were eligible for free or reduced lunch, compared to 50.3 percent of Texas students.  In other words, only 2.6 percent more Texas students are low income than Kansas students. Both were close to the national average of 48.1 percent.  And although it was not noted in Mr. Weeks’ blog, Kansas low income students AND non-low income students have higher NAEP scores than Texas.


Kansas usually exceeds Texas on NAEP scores when considering family income


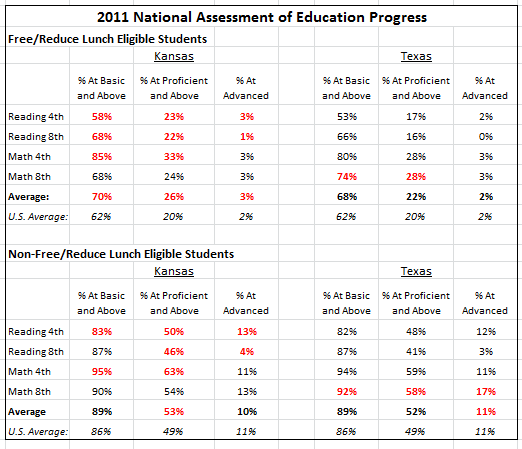
Rather than looking only at “scale scores,” we examined the percentage of students scoring at each of the three main achievement levels reported by NAEP: basic, proficient and advanced.  We have found that a score of “basic” is a fairly good indicator that the student is on track to graduate from high school, while “proficient” is a rough predictor of college readiness on ACT or SAT tests.


As the chart below indicates, low income Kansas students did better on eight of the twelve tests; Texas students did better on two, and two were a tie.  (The higher score is in red.)  In both states, low income students made up about half of the student population.  For higher income students, Kansas had better results on seven of the twelve tests, Texas on three, and two were tied.


However, NAEP tests are only one measure of student achievement, and the highest level tested is eighth grade.  Since few students will be successful based only on eighth grade knowledge and skills, we wanted to look at how Kansas and Texas do preparing students for success after high school.


Kansas and Texas Graduation Rates


We started with high school graduation and dropout rates from the following sources: the 2013 Diplomas Count report, the Digest of Education Statistics table 125 (public high school graduates and graduation rates by state), the Digest of Education Statistics table 126 (the number and percentage of grades 9-12 dropouts by state), the Digest of Education Statistics table 13 (percentage of persons age 18-24 who were high school completers), and U.S. Department of Education adjusted cohort graduation rate for 2011.


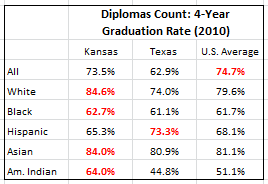
The first report is the respected “Diplomas Count” annual survey of four-year graduation rates (students who achieve a high school diploma within four years of beginning ninth grade).  It shows Kansas graduating roughly 10 percent more students than Texas as a whole, with better results in every major subgroup except Hispanics.  Kansas also exceeds the national average for every group except Hispanics and all students.


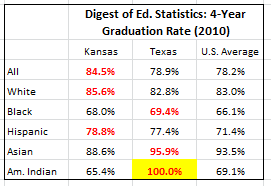
The second report is from the most recent “Digest of Education Statistics” from the U.S. Department of Education. Unlike “Diploma Count,” this report shows Kansas significantly higher than the national average for all students, including Hispanics.  It also shows Texas with a better graduation rate than Kansas for Blacks and Asians.  (In a likely data error, it shows a 100 percent graduation rate for Native Americans, which is contradicted by the next report on the dropout rate from the same source.)

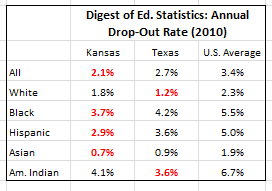
The Digest of Education Statistics also reports on each state’s dropout rate, which is a different calculation than the graduation rate.  It is the number of students who drop out anytime during grades nine through twelve, divided by the total number of ninth through twelfth-graders.  This report shows Kansas with a lower (better) dropout rate for all students, as well as Blacks, Hispanics and Asians, while Texas has a lower rate for Whites and American Indians.


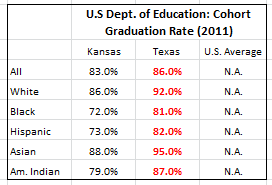
However, a different calculation for high school graduates was released last year by the U.S. Department of Education for the class of 2011, which is a year later than the other data.  This new report shows Texas topping Kansas for every group, and reports Texas has much higher rates than any other study.  It will take some time to determine whether Texas actually made significant improvements between 2010 and 2011, or if there is some different methodology that produces significantly different results.


This means we have three different national reports on the graduation rate for students within four years of ninth grade that give significantly different results.


The final report on high school completion also comes from the Digest of Education Statistics.  Unlike the other data, which looks at graduates and dropouts as a percentage of the high school class or population, this report measures the percentage of persons in the entire population aged 18 to 24 who have received a high school diploma or the equivalent.  Essentially, this captures young adults who did not complete high school “on time,” but have received a secondary school credential within five years of “normal” graduation age through an alternative program.  Kansas leads both Texas and the national average.  Unfortunately, this data does not include subgroups.
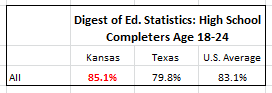


Although this data is frustratingly mixed, it should be noted that Kansas exceeds the national average on every report where a national average is given except one.  Yet Kansas is very close to the national average in low income students - in fact, 30 states have had a lower percentage of free and reduced lunch eligible students in 2011, including every state in the region except for Texas and Oklahoma.


Texas is below the U.S. Average on SAT scores; Kansas tops U.S. on ACT


Finally, we want to look at how well students are prepared for college.  Unfortunately, direct comparisons between Kansas and Texas are not possible because most Kansas high school graduates take the ACT and most Texas graduates take the SAT.  However, we can compare both states to the national average of their majority test.
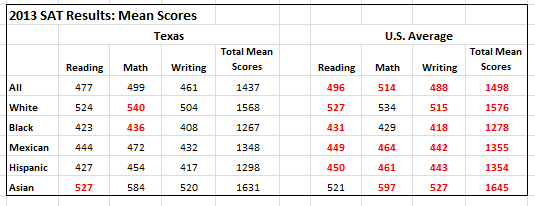


The 2013 SAT results for the graduating class of 2013 were just released.  The only Texas groups that exceed the national SAT average were Whites and Blacks in math, and Asians in reading.  None of the total group scores for Texas exceed the national average.  (We are only listing results for groups that included at least 5 percent of the group tested.  Note also that SAT allows students to identify as “Mexican or Mexican-American,” or as “Hispanic, Latino or Latin American.”)


The ACT testing program reports not only mean scores of tests, but reports the percentage of students whose scores indicate a strong likelihood of completing college-level work in that subject.   As the table below shows, all Kansas students and every subgroup except Asians exceed the U.S. average in every subject.  Kansas Hispanics tied the U.S. average for meeting all four subject benchmarks.
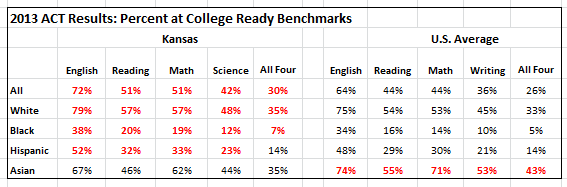

In 2013, ACT reports 75 percent of Kansas high school graduates took the ACT.  Although SAT does not report the percentage tested by state, the number of Texas students tested would equal 59 percent of estimated high school graduates using the same source as the ACT.  Generally, a higher percentage of students tested lowers than the overall state performance (because the higher number includes more students with less ability, preparation or motivation).  However, Kansas does much better compared to the national average of its primary college aptitude test than Texas, despite testing a higher percentage of students.


These results show the limitations of reliance on any single measure of educational performance.  Mr. Weeks’ blog stressed the importance of looking beyond single indicators.  It is clear that Texas does better than Kansas on the NAEP when considering racial and ethnic subgroups, but Kansas does better educating low income students.  Measures of high school completion are also mixed, but Kansas does better for all students and a majority of subgroups on three out of four national reports.  However, Kansas clearly does better in college preparation when compared to the national average on its primary test for all students and most subgroups, while Texas does worse than the national average for the SAT for all groups and for subjects tested.


Both Kansas and Texas spent below the national average per pupil in 2011.  According to the National Center for Education Statistics, Kansas ranked 27th in total revenue per pupil at $11,427.  Texas ranked 37th, spending about $900 less.  Based on the totality of student performance, which state is getting the best results?

Friday, 4 October 2013

NSBA on Education, Fiscal Year 2014 and the Federal Government Shutdown

For a great summary of the impact of the federal shutdown on education, the following is the weekly advocacy update from Kathleen Branch, Director, National Advocacy Services Programs for the National School Boards Association.

NSBA continues to register concerns about the harmful budget cuts to education because of sequestration, which has already reduced funding for Title I grants for disadvantaged students, special education, and other education programs by almost $3 billion in the last fiscal year. 
 
Because House and Senate leaders could not agree on a final bill that would continue funding for education and other programs through December 15, many federal government operations were halted on October 1, the beginning of the federal fiscal year.  As of October 4, we are dealing with day four of the government shutdown; and, NSBA is urging Congress to pass a clean Continuing Resolution (CR) that does not extend the harmful sequestration cuts. 
 
NSBA's concerns over the shutdown and sequestration were covered by POLITICO this week in one of its "Morning Education" columns.  View the press release expressing NSBA's position.
 
With the shutdown, funding for school districts that receive Impact Aid is delayed. (The Impact Aid program provides grants to school districts with nontaxable federal land and installations within their boundaries to make up for the lost revenues and additional costs associated with the federal presence. For example, the program benefits schools with military installations nearby or Indian trust lands.)  Additionally, funding for Head Start is delayed, which has an immediate effect on 23 Head Start programs in 11 states with grants that did not renew on October 1.  These programs are now at risk of closure.
 
Before the federal shutdown began, the U.S. Department of Education published its contingency plan that details its operating status:  ED Contingency Plan for Lapse in FY 2014 Appropriation

The contingency plan notes that funds already appropriated for programs such as Title I, special education, teacher quality and career and technical education would continue.  "For a lapse occurring during the first week of October, the authorized obligations would include the $22 billion in advance appropriations for formula grants to States under Titles I and II of ESEA, IDEA Part B State Grants, and Career and Technical Education," according to the U.S. Department of Education memorandum.  "These funds, which were included in the 2013 appropriation, are normally obligated on October 1 and provide the second nstallment of critical funding under annual allocations for the school year that began July 1. These funds are already appropriated and do not require further Congressional authorization. The Department believes that any delay in obligating these funds could, in some cases, significantly damage State and local program operations. Particularly in light of recent Federal and state funding reductions, the Department considers the October obligation of advance appropriations for formula grants to States under Titles I and II of ESEA, IDEA Part B State Grants, and Career and Technical Education as a necessary exception requiring a limited number of employees to work in the absence of an appropriation of separate administrative funds."
 
NSBA's Center for Public Education prepared the following summary of how education programs are impacted by the shutdown that is available here: http://blog.centerforpubliceducation.org/2013/10/02/how-the-government-shutdown-impacts-public-education/
 
The following points provide some insight about key programs amid the shutdown.
 
  • Head Start: An estimated 19,000 children lost access to Head Start services on October 1, according to the National Head Start Association, and this number will grow as federal grants to programs are not renewed. This is in addition to an estimated 57,000 children who lost services due to the sequester of federal funds the last fiscal year. One million children are enrolled in Head Start nationwide, and 10 - 15% of Head Start programs are affiliated with public school districts.
  • Child nutrition: School lunch and breakfast programs should could continue for the month of October, because schools are reimbursed the month following service. If the government shutdown continues past October, however, the federal government would be unable to provide reimbursement. To the extent that states can pay for school meals without federal reimbursement, meals could continue after October, but overall the program could be in real trouble if the shutdown is not resolved soon.
  • E-Rate: E-Rate commitments for high-need schools and libraries should continue to flow. This is because E-Rate has a temporary exemption from the Anti-Deficiency Act (ADA), the federal law which prohibits the government from incurring any monetary obligation for which Congress has not appropriated funds (and is why the federal government shut down Congress did not pass a budget for the new fiscal year). However, E-Rate's ADA exemption expires December 31, 2013. In addition, a major rulemaking proposal from the Federal Communications Commission to modernize E-Rate is open for public comments untilOctober 16, 2013, but the website for submitting stakeholder input is inoperable due to the shutdown. NSBA's comments on the proposed E-Rate modernization were submitted in September.

Meanwhile, congressional leaders met with President Obama this week.  However, the meeting did not yield any mutual solution to ending the shutdown. The House is slated to consider a series of small continuing resolutions for individual programs this weekend that will continue to impose cuts through sequestration. 
 
You may contact your members at the Capitol Hill switchboard number which is (202) 224-3121,  and/or their state/district offices.  Your outreach to members of Congress is greatly appreciated. 
 

Monday, 30 September 2013

Debate over "real" education funding cuts continues

Earlier this month, I posted a story about a new study from the Center for Budget and Policy Priorities (CBPP) about changes in state funding for K-12 education. Among the findings:


  • Kansas had the fourth-deepest cuts in per pupil state funding between Fiscal Years 2008 and 2014 - 16.5 percent after adjusting for inflation.  (14 states actually raised spending per pupil over the period, including regional states such as Minnesota, Nebraska, Iowa and North Dakota.)


  • Kansas was one of only 15 states to cut per pupil state funding from last year to this year, and had the third-deepest pupil cut in the nation (2.6 percent).  In the region, only Oklahoma cut spending aid per pupil this year.


If you missed it, here is a link to the full report.


Shortly afterwards, the Kansas Policy Institute (KPI) posted this story, arguing the CBPP report was "deliberately misleading;" citing three major objections:


  • First, the CBPP report only considered state funding, which excludes other school district revenues.  (State aid excludes federal funding and local revenues, which provide about 8 percent and 37 percent of total Kansas school funding, respectively.)  KPI suggests revenue from the 20 mill statewide school levy and local option budget tax levies should be included as state funding because it is "provided through state authority."


  • Second, while KPI agrees that total funding per pupil has decreased since 2009 compared to inflation, as KASB has previously discussed (see my blog post "What is the real state of Kansas education funding?"), it presents data showing total spending per pupil is still up about 33 percent over 1998.


  • Third, KPI suggests that school districts could have made up for the lost of funding compared to inflation since 2008 if they had spent all operating funds received, rather than increasing cash balances.


This week, CBPP posted a blog responding to the KPI response, making two major points:


  • First, "a large part of this increase (in total funding) is a sizeable bump in state payments to the teacher retirement fund after years of underfunding left it in danger of not meeting its obligations.  That money will help retired teachers but it won’t help schools offset the big state aid cut."
  • Second, decreases in state funding have been somewhat offset by increases in local funding.  "But these modest increases come nowhere close to offsetting the deep cuts in general state aid.  And a shift in funding responsibilities from the state to localities tends to worsen funding inequities among school districts, since poor districts tend to have a much harder time raising local revenue."
KASB would offer these additional thoughts to this debate:


School Funding, Inflation and Taxpayer Support


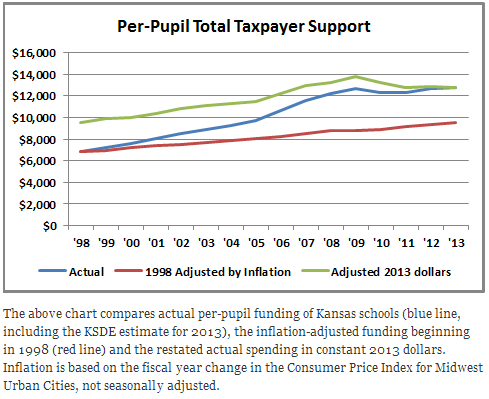
The Kansas Policy Institute blog presents the following chart and explanation of inflation-adjusted school spending in Kansas:


This chart indicates that over the past 15 years, per pupil funding from all tax sources has increased significantly more than inflation.  However, so has taxpayer ability to provide that support.  In fact, total personal income in Kansas has risen from $42 billion in 1989 to $67.8 billion in 1998 to an estimated $124.5 billion in 2013: an increase of nearly 200% while the consumer price index increased about 80%.


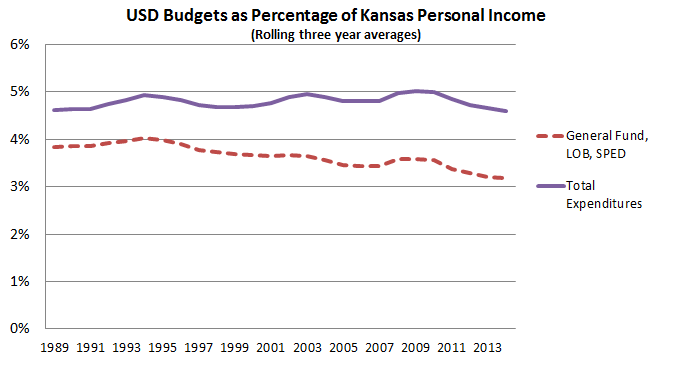
The following chart from KASB data shows funding for school district general fund budgets, local options budgets and special education state aid - which is essentially the state aid plus “state-authorized local aid” described above by KPI - declined from about 4% of Kansas personal income in 1998 to slightly above 3 percent in 2013.  Total funding, which includes school construction and bond payments, capital outlay expenditures, KPERS contributions and other local revenues such as food service and student fees, has hovered at or just below 5 percent of state personal income for the past 25 years, but has been declining since 2009.


Kansas school spending has exceeded inflation for two major reasons.  First, Kansas personal income has increased faster than inflation because income in the private sector has increased more than inflation.  If schools are to compete for high quality employees, they need to keep up with overall wages and benefits.  Second, spending has increased to improve quality and outcomes by adding personnel, positions and investments in new technology and professional development.


This chart also makes clear that the state’s contribution to education, even including KPI’s description of “state authorized local funding,” is declining both compared to the overall Kansas economy and as a share of school funding.  The growing part of school funding are retirement contributions, building and equipment expenditures, food service and student fees.  All of these are important expenditures with a long-term impact on school quality, but they cannot be used to reduce cuts in salaries, positions and programs.


Could schools have avoided these cuts by spending down cash balances?


Consider this example: five years ago, you made $50,000 per year.  Your salary has been cut by $1,000 each of that last five years, so your current salary is $45,000.   However, you’ve been worried about the future, so you tightened your belt and put $1,000 a year into savings, so you have $5,000 more “in the bank” than you did five years ago.


Suppose you had spent that extra $1,000 each year instead of saving it.  Although you would have spent more each year, this year your income would still be $5,000 less than it was five years ago.  Or, you could decide to spend the whole $5,000 THIS YEAR.  Does spending $5,000 from savings AND $45,000 from salary mean your income hasn’t been reduced?  Obviously not, because next year, you won’t have the money in savings and your income will still be $45,000.


It’s exactly the same for schools.  Spending cash balances uses one-time money.  Rather than increasing cash reserves, school districts might have reduced cuts year by year, but that only delays spending cuts.   You can’t use savings to replace reductions in on-going revenues.


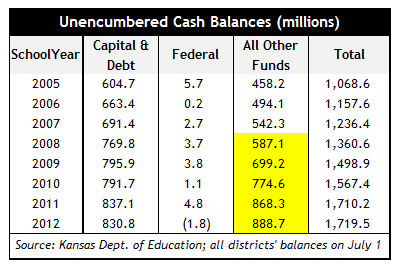
KPI offers the following chart to show the changes in school district July 1 cash balances in recent years.


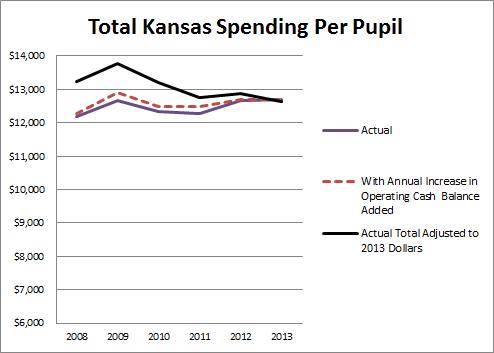
Excluding capital and debt and federal funds, the chart indicates cash balances increased by over $300 million.  I took the annual increase in cash balances in this chart and added this amount to per pupil spending for the previous year.   This indicates what could have been spent if no additional funding had been placed in cash reserves.  I then compared that amount to both actual spending and spending adjusted to 2013 dollars.


As the chart below indicates, this would have provided a slightly higher per pupil amount each year, but the benefit declines as districts stop adding money to reserves.  (The Kansas State Department of Education has not yet released the July 1, 2013, balances so we don’t know if there was an increase for FY 2013.)


Conversely, what if districts had collectively spent the entire $300 million increase in reserves in FY 2013?  It would have increased spending by approximately $650 per pupil last year.  However, districts would have had to reduce spending by that amount in the current year, because they could not replace the use of one-time savings (unless districts used even more of their cash reserves).


Even if cash balances are considered, Kansas has experienced a real decrease in the per pupil funding compared to inflation.  This is compounded by the fact that current operating funding for teachers, support staff and programs have been reduced even more, although funding for retirement contributions, capital costs and debt service has increased.


Tuesday, 24 September 2013

Thoughts on the State of U.S. (and Kansas) Education

The website Politico had a fascinating article this weekend entitled “Do American public schools really stink? Maybe not.”  You will want to read the whole story, but here are the key points and how they apply to Kansas.  KASB will be talking about many of these issues in our ten regional meetings across Kansas over the next three weeks. (To find out more and to register visit www.kasb.org.)

U.S. Students are Falling Behind China and Rest of the World

The story begins with reports of alarm over the 2009 PISA international math test, given to 15-year-olds around the world. “Only 32 percent of American kids scored proficient, which puts us at 32nd in the world, miles behind perennial powerhouses like Shanghai, Singapore, Hong Kong and Korea — and also far behind nations less frequently thought of as academic superstars, including Estonia, Iceland and Slovenia.”

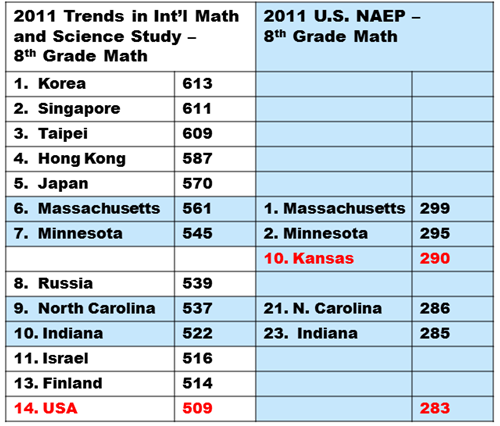
However, the story goes on to report that the U.S. did much better on another (and more recent) test, the 2011 Trends in International Mathematics and Science Study (TIMSS).  As a nation, the U.S. ranked 11th for fourth grade math and 9th for eighth grade math.  Moreover, several U.S. states also participated, and four scored above the U.S. as a whole at 8th grade.  If these states had been participating as individual nations, Massachusetts would have ranked 6th, Minnesota 7th, North Carolina 9th and Indiana 10th.  Although Kansas did not participate, Kansas eighth grade math scores on the 2011 National Assessment for Education Progress were below Massachusetts and Minnesota but higher than North Carolina and Indiana, suggesting that Kansas would rank as a top 10 country, as well as a top 10 state, for math performance.  See details in the chart below:


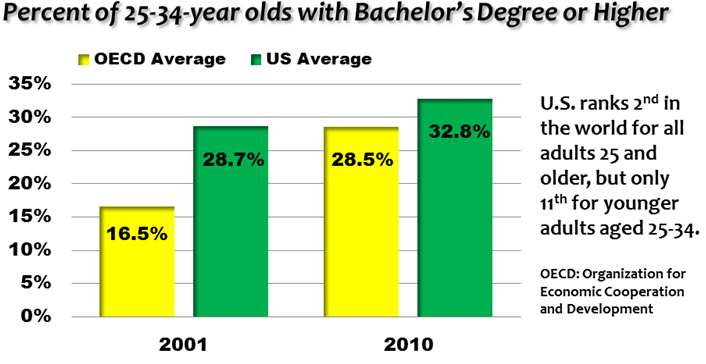
Experts quoted in the story note the U.S. has scored relatively low on international tests for decades, yet has remained an economic superpower in part because of other qualities stressed in American schools over test-taking.  However, long-term economic trends clearly favor more educated individuals.  Kansas is in a better position than most states because it ranks high in adult educational attainment - higher than any states in the region except for Colorado and Minnesota.  However, other industrialized countries have, on average, increased college completion by young adults much faster than the U.S. and Kansas.


We’re Spending More but Schools Are Getting Worse

School spending has increased over the past several decades - but so has the overall economy. The article notes a significant portion of increased school spending has gone to serve students that previously were excluded from public schools or received far less attention and had much less success: special education, bilingual and low-income “at risk” students.

That is certainly true in Kansas. Since 2004, school district operating budgets (general fund plus local option budgets) have increased about $1 billion, and about half was targeted at special education state aid and “restricted” weightings for programs such as at-risk and bilingual services.  In addition, another $250 million was increased for funding the Kansas Public Employees Retirement System, which has almost no impact on current educational services.

Adjusted for inflation and applied per pupil, the facts are even more stark. “Current” spending per pupil for annual operating costs is almost unchanged since 2004 when adjusted to 2013 dollars.  The only significant increase in spending since 2004 has been in KPERS contributions and local bond issues and capital outlay funding approved by local voters. See my earlier blog "What is the real state of Kansas Education Funding?"

The Politico article also points out that many measures of student achievement have actually increased since the 1970’s, including long-term National Assessment of Educational Progress results, graduation rates and college completion. Even more significant is the fact that the U.S. (and Kansas) student populations include many more low-income, minority and immigrant students who tend to perform at lower levels, and these groups have all made progress. This means that additional spending on these students really is paying off.

I talked about these trends in more detail in an a blog post last month.  I noted that despite significant increases in the dollar amount of education spending, funding for K-12 education in the United States is slightly lower as a percentage of personal income, i.e., total taxpayer income, than it was in the 1970’s.  The same is true for Kansas.

An Education Problem or an Equity Problem?

Despite progress over the past 40 years, low income students - who are disproportionately African-American and Hispanic - still have significantly lower achievement levels than their more advantaged peers.  Schools, districts and states with more low income students tend to have much lower performance than schools, districts and states with fewer low income students.

There are two basic solutions proposed to solve this dilemma: more resources or more reform.  The “more resources” camp says “failing schools” are really the result of impoverished neighborhoods and families, and can only be addressed by additional financial resources to offset the lack of resources available for those children.  The “more reform” side argues that more money hasn’t solved the educational inequities so far, and that only new alternatives like charter schools, private school vouchers and tougher standards for teachers and students will work.

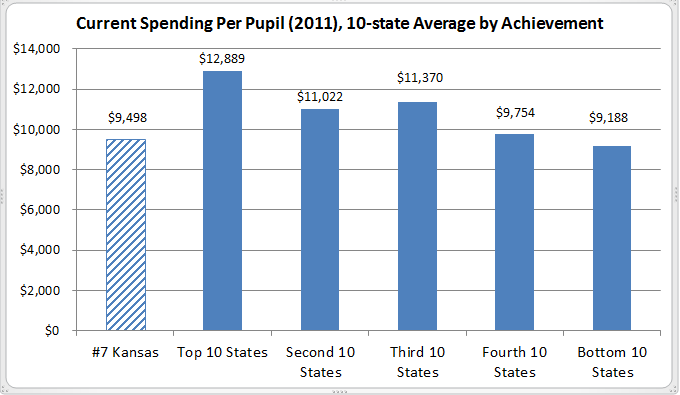
Of course, as noted above, the performance of disadvantaged student groups HAS improved over the past 40 years, especially over the past decade, at the same time new resources have been targeted to these groups.  Moreover, the highest achieving states generally spend the most money per pupil, and the lowest performing states the least. Kansas ranks 7th on an average of four measures of educational attainment through 2012. Every state that ranks higher than Kansas spends more per pupil.


It’s true that higher achieving states also tend to have far fewer low income students, and low achieving states have the most low income students.  To some that may suggest the student population determines achievement, not funding.  But we also know that higher educational attainment results in higher individual income levels and less poverty.  Therefore, it is plausible that states spending more in education and getting better results will have fewer disadvantaged students BECAUSE they invest more in education.

On the other hand, there appears to be no correlation between high state achievement and popular “reform” efforts like charter schools, extensive online programs, vouchers and grade retention based on reading tests.  Florida, for example, is often touted as a model state for education reform. However, on the 2013 ACT test, Florida tested about the same percentage of graduating seniors as Kansas, but had a much lower percentage of “college ready” graduates than Kansas among African-American and White students, and no better scores for Hispanic students.  I explored the relations between funding and achievement in my blog post "Higher funding linked to higher college readiness." Florida also has lower NAEP results than Kansas, not only for all students but for low income students. That means Florida’s lower scores are not simply the result of MORE low income students.

In my view, the Politico article reinforces these positions on education in Kansas and nationally. Public education has made a great deal of progress to be proud of, but economic and social changes demand continued improvement in outcomes.  Funding DOES make a positive impact on achievement, and is far more important than “reform” initiatives that may undercut the commitment of quality public education for all.