Friday, 18 July 2014

Five questions for the new performance and efficiency commission

The Kansas K-12 Student Performance and Efficiency Commission holds its first meeting today.  After the first two appointments by House Speaker Ray Merrick - Dave Trabert of the Kansas Policy Institute and former House Speaker Mike O’Neal of the Kansas Chamber of Commerce and Industry - raised some eyebrows due to their long-standing criticism of many aspects of school districts’ operations, other appointments have created a fairly diverse group.

The Commission now includes two other former legislators widely seen as strong supporters of public education (Senate Vice President John Vratil and Assistant Minority Leader Janis Lee); two superintendents (Shawnee Mission’s Jim Henson and Concordia’s Bev Mortimer); two principals (Meg Wilson of Hoisington High School and Ken Thiessen of Wichita East High School), and Sam Williams, former chairman of the Wichita Metro Chamber of Commerce and a retired advertising executive.  The election of a chair from among these members will be a early sign of the commission’s direction.

(In addition to the voting members, the commissioner of education, the director of the budget, the revisor of statutes, the legislative post auditor and the director of the Legislative Research Department are nonvoting, ex-officio members of the commission.)

Here are some questions the Commission will have to confront:

1.  Is the primary goal to reduce spending or to improve results?

Could Kansas spend less on education?  Kansas ranked 27th in the nation in total revenue per pupil in 2012 (the most recent year national data is available). That is about $800 below the national average.  That means 23 states spent less on each K-12 student.  However, past KASB research has found that each of those 23 states either had lower overall performance on national tests, graduation rates and attainment of educational credentials, or had fewer low income students (who have significantly lower achievement in every state) than Kansas.  KASB is updating this research with new funding and achievement data released this summer.

In fact, the data consistently shows the amount of spending per pupil has a moderate to strong positive correlation with higher academic results.  In other words, more money does TEND to equal higher academic performance.  It is not a perfect correlation by any means - some states get a better “bang for the buck” than others.  However, Kansas is already one of the highest achieving states for the money it spends and the type of students it educates. Specifically, Kansas spends below the national average and is very close to the national average in the percent of low income students, but scores above the national average on virtually every achievement measure KASB has tracked.

As the commission considers recommendations, it will be critically important to examine whether such proposals not only lower costs but also improve educational outcomes.  If Kansas wants better results, we need to look at what states with better performance are doing.

2.  Are there easy ways to reduce educational spending?  

The Kansas Division of Legislative Post Audit has been conducting school district efficiency audits for five years.  Unless the LPA has come up with a different message than it has presented in the past, it will explain that almost all of the “easy” steps to cut costs do not save much money. Significant savings only come from making very difficult choices likely to create significant community opposition: closing buildings, cutting teachers and student services, or outsourcing expenditures away from local employees and vendors.

The simple fact is that “administrative” or “backroom” operations are already a very small part of school district budgets.  Most districts are already involved in numerous cooperative programs. However, many districts continue to operate schools or programs that may seem less efficient than some alternatives because their patrons value those programs.  Which leads to the next question.

3.  Who decides the value of “efficient” or “inefficient” operations?

It is important to remember the state, not local school districts, largely determines how much money districts get to spend on operating budgets through the base budget and weightings and limits on the amount of local option budgets.  Local school boards then make decisions on how to use those funds.  It can be a helpful management tool to consider how one district’s expenditures in certain areas compare to others, but those numbers alone will not tell the whole story.

One district may spend more on student support programs like nurses, counselors and social workers because its community lacks those services from other sources.  Another may spend more on certain purchases like fuel, vehicles and insurance because it wants to support local businesses, even if the cost somewhat higher than alternatives.  Another may want to keep open a school with excess capacity or higher operating costs in order to keep an educational presence in a small community or neighborhood, as way to sustain parent and business involvement.

The issue is not whether these choices are right or wrong. The issue is who should make the choice: the local district through its elected school board or the state?  Who will have to live with the consequences?

4.  How is efficiency measured?

Efficiency is usually defined as getting the best outcomes for the lowest cost or inputs.  Total cost is relatively simple to measure; although the details can be more complicated.  However, measuring educational outcomes on a statewide basis is usually limited to state test scores in reading and math and a few other subjects tested sporadically.  KASB has consistently heard from school leaders and patrons that educational expectations are much broader than standardized tests can measure.

The same bill creating the Performance and Efficiency Commission, HB 2506, adopted new educational goals based on the “Rose” capacities identified by the Kansas Supreme Court.  These goals only directly mention written and oral communications skills among subjects currently tested by the state.  But they also include civic and social engagement, physical and mental health, arts and cultural appreciation, and both academic and vocational preparation for postsecondary education and the workplace.  None of these important educational outcomes - included in the new educational standards - are currently factored into calculations of efficiency.  That is a critical issue for the commission to consider.

Consider recent state legislation and regulations concerning bullying and emergency safety interventions, such as restraining or removing students who pose a threat to themselves or others.  These requirements add significant new costs for staff training and supervision, but are unlikely to improve state reading and math tests.  Therefore, these requirements may be consider “inefficient” because they add costs with improving the only results measured.  However, the Legislature and Kansas State Board of Education clearly value these steps to improve student safety, as do educators, school boards and parents.

5.  How can the state support districts to get better results with available funding?

None of these questions should suggest there is no value to the commission’s work; or that school districts shouldn’t constantly look for ways to get the maximum educational results for the dollars they spend.  One of the reasons the Kansas Association of School Boards exists is to help districts work together to provide more efficient - and effective - ways of operating.  The national performance and spending data described above suggests that Kansas school leaders already take this issue very seriously.  The commission - and the state - need to see local districts as partners looking to achieve the same goals, not obstacles to be overcome.

This means the commission should start with the principle ‘first, do no harm.’ Beware the unintended consequences of new policies.  Remember, Kansas is already a high performing state with below average costs.  What may seem like “inefficiencies” from one perspective (smaller class sizes, schools and districts than most states) could be among the factors contributing to higher achievement.

Second, be consistent.  Ironically, some of the same advocates for consolidating school district operations at a “higher” administrative level also support creating independent charter schools or shifting authority to the building level that would not be required to coordinate anything with local districts.  Likewise, some proposals for additional school budgeting requirements would actually increase district administrative costs with no obvious benefit.  On one hand there are strong advocates for innovation, freedom and flexibility.  On the other hand, here are calls for more controls on how local districts operate.

Third, carrots usually work better than sticks.  KASB has consistently supported incentives for school district consolidation, cooperative and sharing of programs, but also believes the final decision should be made at the local level.  The best approach is not for the state to tell local districts what to do, but to help provide local leaders with the information, training and support to evaluate all options, decide on the best choices for their community; and build support among local patrons.

The commission has an important role for the simple fact that money will always be limited, and educational needs to continue to grow.  The Kansas Constitution requires a system of public schools for “intellectual, educational, vocational and scientific improvement.”  The goal should be finding ways to provide the best educational results for Kansas students. In other words, don’t forget that “Performance” comes before “Efficiency” in the commission’s title.

Tuesday, 8 July 2014

Enrollment projections point to higher costs and achievement challenges

KASB’s annual projection of Kansas school district enrollment for the next five years indicates more students will contribute to school funding costs. Over 90% of Kansas K-12 students continue to attend public schools, and changing demographics mean tougher challenges for student achievement.  Click for the full report from the KASB Research Department and the  KASB media release.  Here are four key points.

Kansas public school enrollment is growing

KASB projects total headcount enrollment will increase by nearly 25,000 students over the next five years, about 1% per year.  That may not sound like a big increase, but it is twice the growth of the last five years.  If all of these students were in one districts, it would be the fourth largest in the state (following Wichita, Olathe and Shawnee Mission).  A total enrollment of over 509,000 would also be the highest statewide public school enrollment since 1972, when the “baby boom” students began to decline.

Growing enrollment adds cost to the school finance system

At the current level of base state aid per pupil ($3,852), 25,000 students will require over $93 million in additional state aid just to keep up with headcount enrollment.  However, these students will also likely add other costs to the system.

Based on current economic statistics, about 10,000, or 40 percent, of these students will be eligible for free lunch, which would result increased at risk weighting.  Some of these students will enroll in career technical education courses, require bilingual or special education services, and transportation, all of which entail higher costs.

In fact, when all weighting adjustments are made, weighted enrollment is currently about 40 percent higher than headcount enrollment.  That means 25,000 additional students would likely result in approximately 35,000 weighted students, which would require about $135 million in five years, or $47 million more than headcount enrollment alone.  This would be the cost of simply keeping the base state aid per pupil at the same level, with no adjustment for inflation or expanded programs..

Public schools consistently enroll over 90% of Kansas students

Over 90% of the Kansas school-aged population has historically enrolled in public schools, which is higher than the national average of 86% to 88%.  Over the past five years, an average of 92.3% of resident live births enroll in Kansas public schools as first graders seven years later.  Also for the past five years, approximately 100% of students enrolled in public schools return for the next grade from first through eighth grade.

In ninth grade, public school enrollment jumps an average of nearly 6% each year; primarily because a number of students who attend nonpublic schools through eighth grade enroll in public high schools for ninth grade.

High school retention falls about 5% in both 10th and 11th grades, and 2% in 12th grade, largely because of students dropping out of school.  Approximately 15% of Kansas students fail to graduate high school by age 24, compared to a national average of about 20%.

The racial composition of Kansas students has changed dramatically, with a major impact on chances for student success.

Two decades ago, the Kansas public school population was 85% white, 8% black and less than 5% Hispanic.  White enrollment declined to 66% of the total enrollment for Kansas this year and is projected to be just 62% in 2019.  Black students enrollment has dropped slightly, and is projected to be less than 7% of the population in 2019.  Hispanic students have increased to nearly 18% of public school enrollment this year, and are projected to reach almost 22% in 2019.

This change alone helps explain the substantial increase in low income students eligible for free or reduced price meals; which rose from about one-third in 2011 to nearly half in 2013.  According to federal census data, Hispanic or Latino per capita income in Kansas is less than half of white income, and lower than any other racial or ethnic group.

The changing faces of Kansas students will make it more difficult for Kansas to improve or even maintain current levels of student achievement.  For example, 95 percent of middle and upper-income Kansas students graduate within four years, compared to just 76 percent of students eligible for free meals.  In both cases, Kansas far exceeds the national average.  (For details, see this report.)  In Kansas public schools, as in other states and private schools nationally and in Kansas, low income students, Hispanics and African Americans continue have lower educational achievement rates, although in most cases the gap has narrowed over the past decade.

The new enrollment projections are a reminder that state and local education and finance policies cannot be static; they must take into account the changing needs of Kansas students.

Sunday, 1 June 2014

What state tax shortfalls may mean for K-12 funding

State general fund receipts for May were $217 million below expectations, on top a of $92 million shortfall in April.  What does that mean for the state budget and education funding?  The state general fund can handle the shortfall in the short term, but the long-term impact will likely further limit K-12 funding.


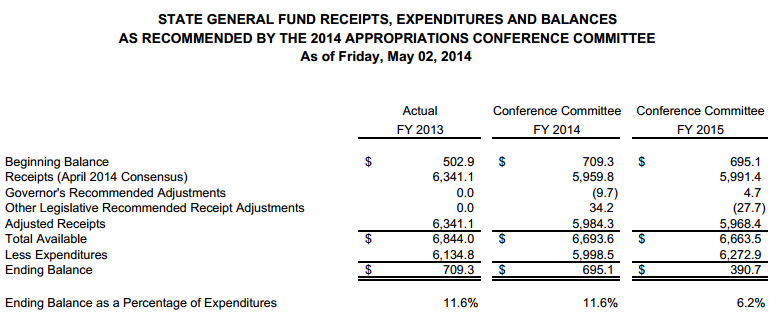
As illustrated in the chart below from the Kansas Legislative Research Department, the official consensus revenue estimate (CRE) released in mid-April projected the state general fund (SGF) would have $5.96 billion in receipts this fiscal year, which ends June 30.  That was down about $300 million from last year as a result of state income tax cuts.  However, the SGF began the year with a balance of over $700 million.  With expenditures of just under $6 million - also reduced from the previous year - the SGF was still expected to have a healthy FY 2014 ending balance of $695 million, or 11.6%.


The actual receipts for April and May, however, indicate that the June 30 ending balance could be closer to $385 million, or 6.4%.  The real impact would be in Fiscal Year 2015, which was projected to have an ending balance of $391 million.  Assuming receipts this June (the last month of FY 2014) and receipts for all of 2015 are exactly as projected by the April CRE, the FY 2015 ending balance would drop to approximately $80 million or less than 1.3 percent.


Of course, the CRE is just an estimate.  If actual receipts begin to begin to pick up, the ending balance would be higher.  But it means there is little margin for error - if actual revenues continue to drop, the state would face a budget deficit that would require corrective active action, such as reducing funding for state programs.  K-12 education receives over 50% of SGF spending..


The Brownback administration’s spokesmen say the drop in April and May is a one-time event, due to investors taking capital gains in 2012, which reduced their income in 2013 and therefore income tax revenues in 2013-14.  In fact, there is little evidence that the overall Kansas economy is slumping.  On the other hand, despite the tax cuts, the April CRE projected Kansas personal income to grow at a lower rate than the national average in both 2014 and 2015.


The real problem may be in FY 2016.  Note that SGF spending increased from $5.999 billion this year to $6.273 billion in 2015.  Of that $270 million increase, over $200 million was for K-12 education aid, including $109 million for local option budget aid; $25 million for capital outlay aid; $35 million for KPERS payments; $33.5 million for special education; and $7 million for bond and interest aid.


Because SGF revenues were projected to increase just $40 million (due to continuing income tax rate cuts), SGF expenditures were already projected to exceed revenues by $282 million, dropping the ending balance from almost $700 million to under $400 million.  The shortfall in April and May would lower that balance to less than $100 million.


Assuming that shortfall was a one-time occurrence as the administration believes and the revenue forecast for 2015 is accurate, state general fund revenues will have to increase at least $200 million in 2016 to avoid a deficit, a growth rate of 3.4 percent.  However, the Kansas economy will have to grow at an even faster rate to generate that much revenue, because another income tax rate cut will take effect in 2016.  Even that growth rate would leave no ending balance and provide no additional funding for state programs, including a scheduled increase in KPERS contributions; payments of bond issues approved by voters, increased state aid to match local option budgets, and rising special education costs.  This does not include ANY increase in base state aid per pupil for district operating costs, or higher enrollment.

In short, even if the shortfalls of the past two months are temporary, the outlook for state school funding beyond next year is likely to be extremely challenging unless the state economy begins to grow far more rapidly than current projections.

Thursday, 29 May 2014

Mapping student achievement, poverty and school funding

The KASB advocacy tour is in Liberal, where we will hold an advocacy breakfast meeting before heading to Garden City for a lunch meeting and hold a briefing for Legislative candidates this afternoon. We'll wrap up the first week of the tour Friday morning in Dodge City.

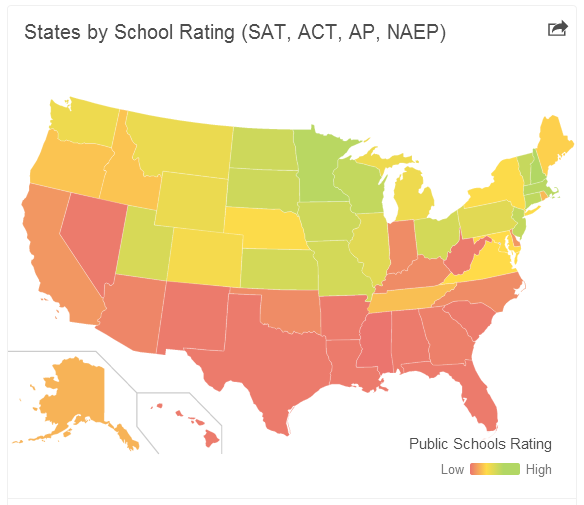
Earlier this week, KASB social media followers posted the map shown below, from the search engine FindTheBest. It shows how states rank on a several national academic tests.  States in dark green had the highest results; light green for the next best (including Kansas); followed by yellow, orange, tan, light red and dark red.  Quite clearly, the New England, middle Atlantic and Midwestern states have the best performance, while southern and western states do the worst.

For KASB, I have used a somewhat different way of ranking states that includes high school graduation and adult education levels, but the results are similar.


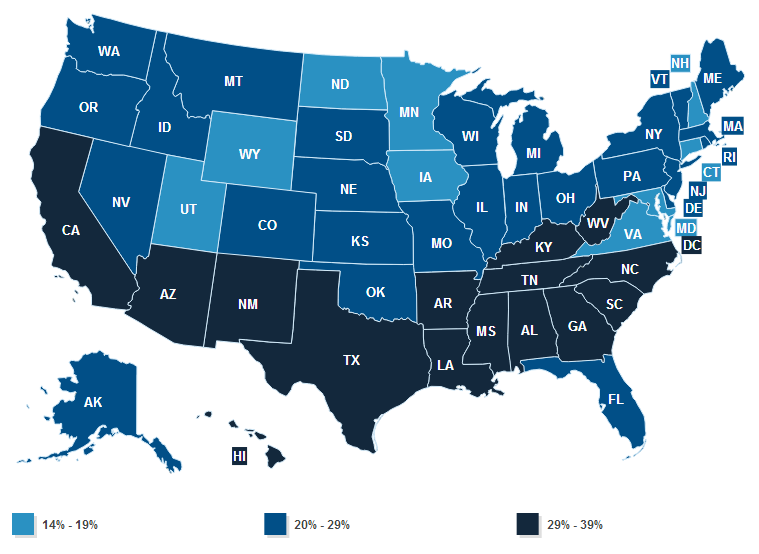
Yesterday, another map was posted by Kansas Action for Children that shows some of the reasons for - or consequences of - differences in student achievement.  This map, from the Kaiser Family Foundation state health facts section, shows the percentage of persons age 18 and under in poverty by state.


Strikingly, most states with the lowest poverty are among the higher achieving states on national tests, while the south and southwest tends to have high poverty and low achievement.  Why?  Students from low income families tend to have more difficulty reaching higher levels in school, and families whose parents have lower education levels are much more likely to have lower incomes.  Poverty is therefore both a cause and effect of lower student achievement.

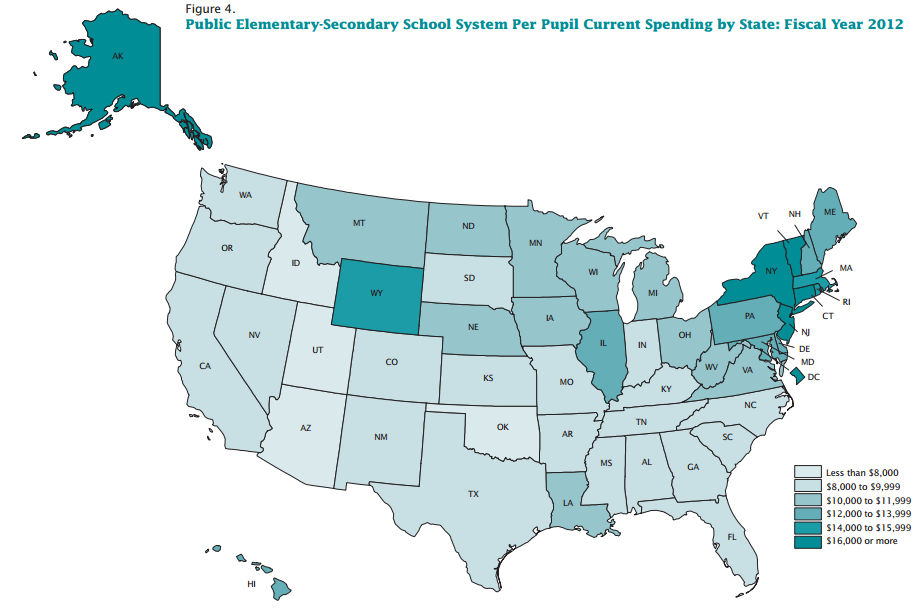
Finally, here is a third map from the U.S. Census Bureau’s Public Education Finances: 2012 showing current spending per pupil for each state.  Note that the highest spending states are in the northeast, which generally also have higher student achievement and less poverty.  On the other hand, most of the lowest spending states range across the south and southwest, with lower student achievement and higher poverty rates.


These three maps strongly indicate that higher spending on K-12 education not only results in better student, but also creates more economic prosperity by reducing childhood poverty.

One media outlet suggested the first map shows a new "Mason-Dixon Line" for educational achievement, referring to the old division between north and south before the Civil War. That line appears to extend to poverty and educational support as well. Which side of the line should Kansas be on?

Wednesday, 28 May 2014

12th Grade National Tests: No Growth, Low College Readiness, and Funding Makes a Difference

The Tallman Education Report comes from Hays, Kansas today as KASB begins its 2014 Advocacy Tour with a breakfast event, followed by a meeting at noon in Oakley.  We will continue through western Kansas this week, in Liberal and Garden City tomorrow (Thursday) and Dodge City Friday.

Yesterday, I talked about a new report on high school graduation rates celebrating an all time high percentage of high school completion nationally.  However, this good news was undercut by a second national report, the 2013 National Assessment of Educational Progress 12th Grade reading and math tests. Three things stand out.

First, national results are basically unchanged since the test was given four years before in 2009. That is different from the 4th and 8th grade NAEP reading and math assessments, which have shown upward movement nationally and in most states.  One reason may be that the higher graduation rate means more students who previously would have dropped out are staying in school and being tested.  In other words, flat scores can still indicate progress if schools are getting the same results when a more challenging group of students are included.

Second, only about one-fourth of students score at the “proficient” level in math and only one-third are proficient in English.  I’ve found these results are roughly equal to the percentage of students meeting “college ready” benchmarks in the ACT and SAT.  This indicates only about 25% of all students (not just those who take the ACT or SAT) are really ready for college level math and 36% for college level English.  These levels fall short of national estimates that between 60% and 70% of future U.S. jobs will require some level of college education.

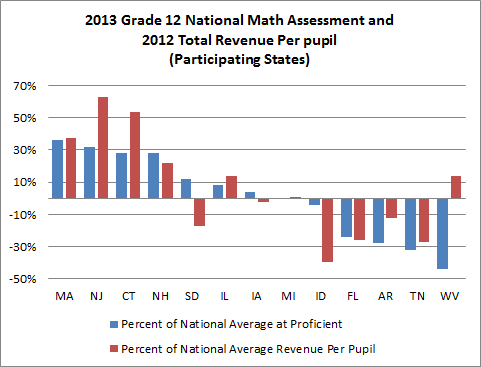
Third, these tests are another indication that the amount of state funding for K-12 education is linked to results.  Unlike the 4th and 8th grade tests which are reported for every state, no 12th grade scores are released for most states, including Kansas.  However, 13 states participated in 2013 on a pilot basis where a statistically reliable state results can be given.  The results are shown in the chart below:


Because of the on-going to debate over the link between school funding and performance, we wanted to see if there is a relationship between the percent of students scoring at or above proficient (college ready) and total K-12 revenues provided in each state, based on the latest national data in Public Education Finance: 2012 from the U.S. Census Bureau.

To provide a common scale for comparison, we calculated each state’s test results and total funding as a percent of the U.S. average.  For example, the chart shows that Massachusetts, which has the highest percentage of students scoring proficient or higher in math, is more than 30% above the national average.  Revenue per pupil in Massachusetts in also more than 30% above the national average.

Here are the results for the mathematics test:


The chart shows a clear correlation between higher spending and higher achievement, and lower spending and lower achievement.  Of the seven states with higher math achievement than average, all but South Dakota and Iowa also spent above average, and Iowa is very close the U.S. average in both achievement and spending.  Michigan is even closer.  On the other hand, of the five states with math proficiency below the U.S. average, all but West Virginia also spent below average.

There are other factors that affect student achievement - most significantly, the percent of low income students - but this data clearly shows that that highest achieving states on this assessments are more more likely to spend more per pupil; and lowest spenders are more likely to have lower achievement.

That's a challenge for Kansas, which spends BELOW the U.S. average.


Tuesday, 27 May 2014

Graduation rates hit new high but troubling issues remain

It’s that time of year: high school commencements are mostly completed, the school year is ending, and the Tallman Education Report will be on road for the Kansas Association of School Boards summer advocacy tour for the next five weeks.

The tour start tomorrow in Hays with a 7:30 a.m. breakfast meeting, followed by a noon lunch meeting in Oakley; the first of 23 stops across Kansas to talk with school board members and other leaders about the future of Kansas public education.  In particular, we will focus on the so-called “Rose” standards identified by the Kansas Supreme Court as the threshold learning levels for every child and adopted by the 2014 Legislature as the goals for K-12 education.  We will be exploring what those standards are, how they measured, how Kansas “measures up” and how we can improve the performance of our students and schools.

The Rose standards really speak to preparing students for successful lives.  We can celebrate some good news about one standard of achievement: a new report finds that the U.S. graduation rate hit an all-time high of 80% in 2012.  Kansas topped the national average at 85%, ranking 14th in the nation.

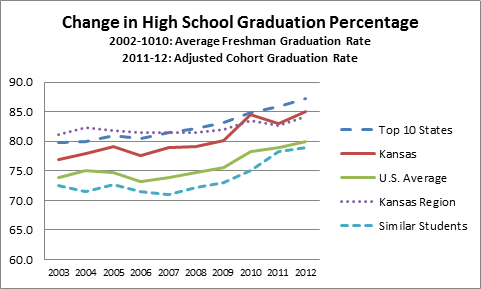
I’ve developed the following chart from information in that report, based in the most recent national data from the U.S. Department of Education.


Over the past 10 years, the national graduation rate for students within four years of starting high school rose from below 75% to 80%, while in Kansas it increased from 77% to 85%.  Kansas previously trailed its 10-state region (North and South Dakota, Minnesota, Nebraska, Iowa, Colorado, Missouri, Oklahoma and Texas), but now slightly exceeds the regional average.  Kansas also does better than the 10 states with most similar percentage of low income students - the key demographic in student achievement - and slightly gained ground on the top 10 states in overall graduation rates.

Despite this positive news, there are some important issues to face.  First, having the highest graduation rate ever still isn’t high enough to meet the projected needs of students, the state and the nation.  Experts says by 2020, approximately 90 percent of jobs will require a high school diploma, which means even Kansas is falling about five percent short.  Students who fail to complete high school simply won’t quality for most jobs.

Second, students from middle-income and higher-income families are already at that target: the new report shows that 95% of these students in Kansas graduated on time in 2012.  However, only 76% of Kansas students who were eligible for free or reduced price meals graduated on time in 2012.  That is still above the national average of 72% for low income students, but the 19% income level gap in Kansas is higher than the 15% gap nationally.

Third, the percentage of low-income students has risen sharply both nationally and in Kansas.  In 2001, 38.3% of students nationally and 33.4% of students in Kansas qualified for free or reduced price meals.  By 2012, the numbers were 49.6% nationally and 48.9% in Kansas.

Finally and most important, the income gap creates a vicious downward cycle. Low income students are more likely to fail to complete high school on time, which means they are also less likely to ever graduate and receive additional postsecondary education.  High school drop-outs have much lower salaries and much higher poverty rates than than individuals who finish high school, and earnings further increase with every level of postsecondary education attained.

In other words, because lower income students are more likely to drop out of high school, they are also much more likely remain in poverty or at low income levels - which means their children will also be more at-risk of dropping out.  The changing national and state economy has sharply reduced low skill jobs and kept these wages low - which helps explain why the percentage of low income students is growing.

We will examine all of these issues at the KASB advocacy meetings and through this blog in the coming weeks and months.

Tuesday, 29 April 2014

What does the new school finance law mean for school budgets next year?

(Updated April 30 to include new inflation estimates.)

Total state aid to school districts will increase by $173 million next year, or 5.3% over the current year under the bill signed by Governor Brownback last week.  However, school operating budgets - the funds available for "classroom" costs such as teacher salaries, staff positions and utilities but exclude pension payments and capital expenditures - are expected to increase 1.5%, and just 1.3% on the per pupil basis.


That means the regular operating funding per pupil will increase, but probably not as much as the rate of which inflation, was projected to be 2.1% next year in the most recent state revenue estimates.  Total funding per pupil, which includes capital costs (building and equipment) and state pension contributions, is projected to be an increase of 2.4%, but more than half of the total increase cannot be used for regular operating expenditures.


These projections reflect statewide totals.  Individual district budgets will differ significantly for reasons explained below.  Overall growth that is less than inflation and actual funding reductions in some districts is why many districts are already considering potential budget and personnel cuts and even though statewide total funding will increase.


These estimates were developed by KASB based on the previous estimates developed by the Kansas State Department of Education, the Division of Budget and the Legislative Research Department, revised by the appropriations provided in HB 2506 and new projections from these state agencies.


It is important to stress that these are only estimates.  The actual increase in funding will be determined by how much additional local option budget authority local school boards decide to use, changes in local capital outlay use and payments on school construction bonds, and other local revenues not budgeted at the state level.  Actual per pupil spending will depend on actual enrollment, which will not be known until next year.


Here is a summary of what KASB expects, based on the school finance bill.
General Funds Budgets.  The foundation of the school finance system is the district general fund budget, determined by multiplying the base budget per pupil by adjusted, or weighted, enrollment.  The base budget per pupil will increase by $14, to $3,852, or 0.4%.  HB 2506 reduced district at-risk weighting in several areas to cut state funding by $8.2 million.  At the same time, both regular and weighted enrollments are projected to increase, which means total general fund budgets will increase by $13.3 million, or 0.5%.  Some districts will lose more because of cuts in at-risk weightings, while other districts will get a bigger increase because of higher enrollment growth.
Special Education Aid. State special education aid will increase slightly (0.01%) to meet estimated federal maintenance of effort requirements.
Local Option Budgets.  One of the most complicated aspects of the new bill concerns the local option budget.  The State Department of Education estimates that actual LOB revenues - what districts can spend - will increase by $46 million.  Here is how the $46 million estimated increase was developed:


  • First, the maximum LOB a district can adopt is controlled by the state. Under current law, the maximum was 31% of the district’s general fund budget plus special education state aid.  Any amount over 30% required approval by district voters.


Not all districts are currently at the maximum.  One reason is that the LOB is funded in two ways: local property taxes plus state aid for approximately 81% of districts, based on local property tax wealth per pupil.  (The wealthiest 19% of districts in valuation per pupil do not receive state aid.)  Because the state has not been fully funded the LOB state aid formula, lower wealth districts had to rely more heavily on local property taxes, which created pressure to hold down the LOB and keep mill levies in check.


Keep in mind that lower wealth districts require much higher property tax rates to raise the same amount of money as wealthy districts. That was the basis of the Supreme Court’s Gannon ruling on school finance equity.  It said the state must either fully fund LOB aid or take other action to correct the “wealth-based disparities” in the LOB.  KSDE indicates that fully funding LOB state aid will increase the percentage of statewide LOB authority districts would use. In other words, districts cut back on LOB use because the state wasn’t paying its share; if state aid was fully funded, districts would use more LOB because the property tax cost would be lower.


  • Second, the LOB system is further complicated by the fact that since 2010, the Legislature has allowed the district’s general fund budget to be calculated for determining the LOB as if the base budget per pupil was $4,433 (the amount districts used to adopt their budgets in 2008-09), rather than actual base, which was reduced to $4,012 in 2009-10; $3,937 in 2010-11 and $3,780 in 2011-12.  (It was increased to $3,838 last year and remained the same for the current year.)  Without the artificial base, districts at or near the maximum percentage would have been required cut their LOB.


HB 2506 increased the actual base to $3,852 next year, an increase of $14. However, the bill also increases the artificial LOB base from $4,433 to $4,490, for the next two years only.  This essentially means that districts can raise more money through their LOB without raising the percentage, because the same percentage applied to a large (artificial) base is a higher number.  However, this increase is temporary.


  • Third, HB 2506 changes state law to take the enrollment of students counted in virtual education programs out of the budget for determining the LOB amount.  For example, if a district had 95% of its enrollment in regular “bricks and mortar” programs and 5% in on-line programs, it can now only apply its LOB percentage to the 95% of students in non-virtual programs.  This will a major impact on districts with large virtual enrollment.


The impact of these changes means that districts statewide are expected to increase LOB revenue; i.e. the total they can spend, by $36 million.  That assumes use of 74% of the new revenue available.  However, some districts are projected to have less LOB revenue - in other words, a cut in dollars available - primarily because of the change in virtual weighting.


  • A fourth change in the LOB law increases the maximum LOB amount from 31% to 33%.  Any LOB level above 30% will continue to require voter approval in an election, but the new law requires that future LOB elections must be conducted by mail ballot.  However, in a twist, districts that have already adopted an LOB above 30% by July 1 can adopt an additional 2% for next year without an election - but must submit the additional amount to voters for the following year.  KSDE expect these districts to increase their LOB’s by about $10 million next year.


The $36 million LOB increase due to the higher artificial base and other changes, added to the $10 million LOB increase for districts already over 30%, equals the projected $46 million higher LOB spending next year.  However, in order to fully fund the LOB aid formula, state LOB aid will increase about $110 million.  Approximately $14 million will be required to “equalize” the additional LOB spending.  The difference will be property tax reduction.  In other words, because a district’s LOB is capped by the state, if state aid increases more than the LOB amount goes up, it automatically reduces the district’s LOB property tax.


Three things are important to stress.  


  • First, the impact on individual districts will differ significantly.  Some districts will receive NO additional state aid because they are higher wealth districts.  Any increase in LOB will require a higher local mill levy. Other districts will be able to raise the LOB amount and still reduce their mill levy.  Still others may choose to keep the LOB at the same level and use all new state aid to reduce property taxes.  The decision will be made by the local school board.


  • Second, these are estimates.  Districts could end up using more of the new LOB authority - or less in order to hold down property taxes.


  • Third, note that a big portion of the new LOB funding may be temporary.  The artificial base will drop from $4,490 to $4,433 in two years, and completely expires after three years unless the Legislature extends it. The estimated $10 million LOB increase for districts already above 30% could be rejected by voters next year.


Federal Aid.  KASB includes federal aid at this point because some of these funds are available for current operating costs, such as teacher salaries.  Federal aid is expected to increase $8 million next year (1.8%), with $5 million for increased free and reduced price meal payments for low income students, and $3 million for special education, Title I programs for disadvantaged students, career technical education and other programs for students and teachers.


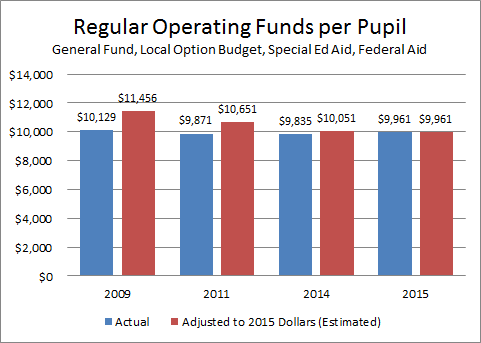
Total Operating Expenditures.  These four budget areas (general fund, state special education aid, local option budgets and federal aid) represent almost all of the funding school districts can use for current expenditures like salaries, operations and maintenance.  KASB estimates the statewide total next year at $4.58 billion, an increase of $67.9 million over the current year, or 1.5%.  On a per pupil basis, using full time equivalent enrollment, funding is expected to increase from $9,835 to $9,961, or 1.3%.


This level would be $90, or 0.9%, higher than 2011, the first year of Governor Brownback’s administration, and $168, or 1.7%, lower than 2009, the highest level of funding before budget cuts began as a result of the Great Recession.  The inflation rate, measured by the consumer price index, is projected to be nearly 8% higher than in 2011 and 13% higher than in 2009.


Capital Aid.  Other parts of school district budgets have increased much more than operating expenditures.  To comply with the Gannon decision, HB 2506 also includes $25.2 million to fully fund the capital outlay state aid program, which has not been funded since 2010.  These funds are restricted to long-term expenditures, such as building construction, repair and remodeling, and equipment.  The new law also expands use to performance uniforms and computer software.  It is also possible that some districts will be able to use additional capital outlay aid to reduce transfers from other funds and free up money for general operating costs.


In addition, the bill provides $7 million more for bond and interest state aid.  Both capital outlay and bond and interest aid are provided to districts with lower wealth per pupil to help finance capital costs without requiring disproportionately higher mill levies for these purposes.


In 2009, capital outlay aid was $22.3 million and bond and interest aid was $75.6 million.  Next year, funding will be $25.2 million and $135 million - an increase of over 60% in these programs combined since 2009.


KPERS Funding.  Another area of significant growth has been contributions for school district employees’ pensions under the Kansas Public Employees Retirement System.  The contribution is based on a percentage of school district payroll for covered employees.  Because the KPERS system is significantly underfunded, the Legislature has been increasing the percentage.  Next year, the KPERS appropriation for school employees - which also includes employees of community and technical colleges - will increase by $37.2 million, or 10.3%, to $398 million.  This amount has increased nearly 65% since 2009.  Approximately 91% of the KPERS school appropriation goes to school districts and is included in district budgets.


All other revenues.  The remainder of school district budgets are raised from local revenues, such as school district bond payments, local capital outlay revenues, and student fee for meals, books, activities and transportation.  Because these funds are not budgeted at the state level, it is difficult to provide an accurate estimate, but for this purpose, KASB is assuming these revenues will increase 2% next year, based on comparable increases in recent years.


Total expenditures per pupil. Based on appropriations for capital outlay, bond and interest and KPERS funding and a 2% increase in all other revenues added to the total operating funds estimated above, KASB estimates that total school districts expenditures will increase $153.4 million, or 2.6%, next year, which would be 2.4% per pupil.  This would be just slightly higher than the inflation rate projected last fall by state budget experts.  However, it is important to note that less than half of that amount is for regular operating expenditures that make up 75% of district budgets statewide.


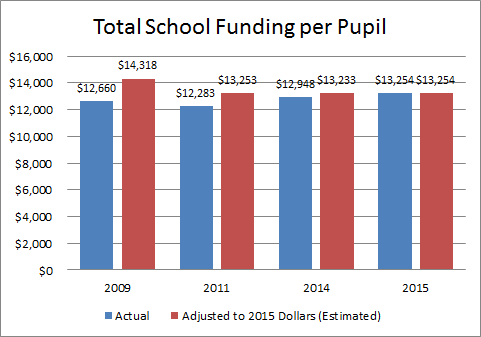
This would result in a total expenditure per pupil of $13,254, up from an estimated $12,948 in the current year.   The 2015 estimate would be 4.7% higher than 2009, an increase of less than half the rate of inflation.  (The consumer price index is projected to have increased 13.1% between 2009 and 2015.) The actual total expenditure per pupil will not be known until next fall when school district budgets are reported to the state.