Wednesday, 12 August 2015

Kansas School Districts and Funding for Instruction

Looking only at how much money school districts spend on instruction is like comparing baseball teams based on batting average, rather than wins and losses. It is an indicator, but it doesn’t guarantee results.


Spending on instruction doesn’t tell how successful a district or state is at educating students. Just as pitching, defense, and strategy also contribute to team’s performance on the field, other areas of school spending have big influence on student success.


And by most measurements, Kansas schools are succeeding.


Using 14 measures of student achievement and attainment, Kansas leads 44 states on a majority of those indicators. Of the five state with higher results than Kansas, all five have significantly higher funding per pupil. In addition, of those five, three spent a higher percentage of their total funding on instruction and two spent less.


On the other hand, 18 states spent a higher percentage of total funding on instruction, and have lower achievement than Kansas. The remaining 26 states had both a lower percentage spent on instruction and lower achievement.


It is clear that simply shifting more money to instructional spending will not guarantee improved student success.


The issue arose again recently when Governor Sam Brownback urged school districts to shift more funding to “the classroom” and said most districts are not complying with state law.


Contrary to some claims, there is no legal requirement that each Kansas school district must spend 65 percent of its budget on instruction. There is a state law expressing a “public policy goal” that at least 65 percent of money provided by the state to “school districts” be spent on instruction, which reads as follows:


K.S.A. 72-64c01. Sixty-five percent of moneys to be spent on instruction. (a) It is the public policy goal of the state of Kansas that at least 65% of the moneys appropriated, distributed or otherwise provided by the state to school districts shall be expended in the classroom or for instruction.


According to the Kansas State Department of Education, in 2013-14 school districts spent $3,033,444,556 on instruction, which is 92.8 percent of total state aid provided in 2013-14 ($3,267,998,852). If $615 million from the 20 mill statewide property tax levy was included as state aid, spending on instruction equals 78 percent of this total.


However, Kansas school districts do not spend 65 percent of ALL revenues on instruction. Kansas spends about 52 percent of total revenues on instruction, ranking 22nd in the nation, and 62 percent of “current expenditures” on instruction, ranking 9th.


This means Kansas school boards devote a greater share of their annual operating budgets to instruction than 41 other states, but spend a smaller share of total revenues on instruction than other states. That is primarily because Kansas voters have approved spending a larger amount for classroom buildings and equipment than other states.


No state spends 65 percent of total funding on instruction. Only three states spend at least 65 percent of “current operating funds” on instruction.


State law does not - and should not - require all school districts to spend 65 percent of their budget on instruction, because districts have very different expenses they often cannot control. For example, districts paying for construction bonds approved by local voters, or transporting more students in rural areas, or with high special services costs for students with disabilities will have to spend more on those areas than districts that do not have those costs.


The budget classification for instruction leaves out significant expenditures that support student success and/or are required by law. Here is the most recent statewide breakdown of Kansas school district spending (2013-14 school year):


51.8% - Instruction: teachers, paraprofessionals, classroom aides, classroom materials.
17.4% - Capital costs and debt payments: construction, repair and remodeling of school buildings, including classrooms, libraries, gyms, auditoriums, lunchrooms, technology and other equipment.
8.1% - Maintenance and Operations: includes utilities, insurance and security.
3.4% - Transportation: busing or providing alternative transportation for students.
4.1% - Food service: lunch and breakfast programs.
4.1% - Student Support: counselors, social workers,psychologists, speech pathologists, audiologist, nurses, attendance and resource officers.
3.2% - Instructional Support: Librarians, technology support and staff professional development.
4.8% - School Administration: principals and school office support staff.
4.2% - All other: district administration, business operations, human resources and legal services.
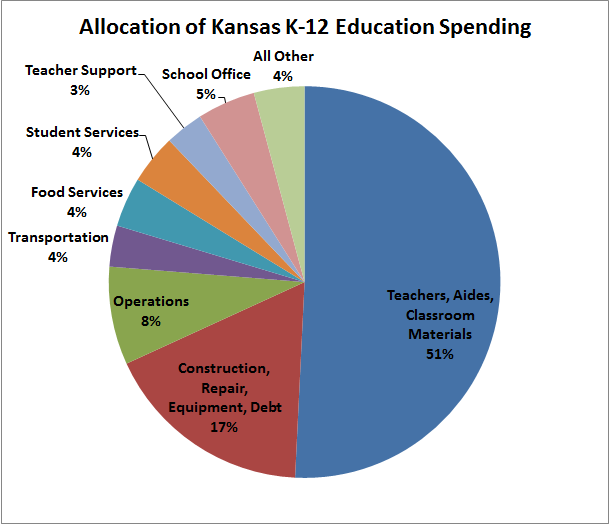


In order to spend 65 percent of all funding on instruction, school districts would have to shift 13 percent of funding from other areas. This amount is more than the TOTAL spent on administration at the local and district level, PLUS all transportation costs.


Just as baseball teams can be successful in different ways, Kansas school districts strive to use their resources to fit their unique community needs and circumstances.


Kansas school boards are always looking at ways to operate more efficiently with the goal of putting more resources in the classroom to help produce successful students. KASB services and partnerships with other organizations are designed to help them in these efforts.


Directing districts to spend money on arbitrary statewide targets is the opposite of the local control and budget flexibility the Governor and Legislative leaders have been championing.


Wednesday, 29 July 2015

Are school district ending balances too high?

Each July, Kansas school boards receive reports from their superintendents on the unencumbered cash balance of specific funds as of July 1. As districts struggle with tough choices as budgets get adopted over the next month, questions are expected to be raised about whether cash balances are too high.

The facts are: school districts have actually been cutting cash balances compared to budgets, school balances are actually lower than comparable state balances, and districts continue to face uncertainty in state revenues.

Districts have cash balances for three major reasons. The first is to have money on hand to pay expenses that come due before the income to pay for those expenses arrives. This is called “cash flow.”

It is similar to individuals who need money in their checking account at the end of the month to cover rent or a house payment due at the first of the month before the next payday. That doesn’t mean the person ended the month with “extra” money. Likewise, school districts need money on hand in areas like special education and food service at the start of the year to begin operating until state, federal and local revenues such as student fees come in.

The second reason for cash balances is if income turns out to be less than expected, or expenses run higher than budgeted. This is called having money for contingencies.

For an individual, that means keeping extra money on hand in case of working fewer hours or receiving smaller commissions than planned, or having an unplanned expense. For school districts, it means state aid might be reduced mid-year (as happened last Spring).

The third reason for cash balances is to allow for planned expenses in the future without borrowing. For individuals, this might mean saving for a vacation or home improvement. For school districts, it means building up funds for a new school bus, roof repair or textbook purchase.

Critics of school district balances have noted the total amount at the start of the year on July 1 has increased significantly, from about $1.16 billion in 2006 to $1.71 billion last year. However, as a percentage of total school district expenditures, cash balances increased from approximately 25 percent of expenditures prior to 30 percent during and following the economic recession of 2008 through 2010, and has been declining since 2011. (Cash balances and total expenditures for 2015 have not yet been released by the state.)

School district balances accelerated at exactly the time when districts faced delays in state aid payments, reductions in state funding levels and general uncertainty over future funding. In fact, the Kansas Senate passed a resolution specifically encouraging districts to build up reserves to address the revenue when federal economic stimulus funding ended in 2011. That is exactly what happened statewide.

The Legislature has recognized much of the money in district cash balances cannot be used for regular operating purposes. In fact, school districts have about 30 different “funds” established by the Legislature to allow tracking of how school districts spend their money and make sure it is spent for appropriate purposes.

Over 70 percent of cash balances in school district funds are essentially restricted because they are raised from special mill levies, federal funds or student fees, or are required for special education programs or insurance reserves.

However, in recent years the Legislature has given districts more flexibility in shifting money from special funds to general operations, beginning with Senate Bill 111 in 2012. The largest is the contingency reserve fund, but there are about a dozen other “operating” funds where the Legislature has allowed more flexible use.


Like total cash balances compared to total expenditures, the money in these flexible funds increased as a percentage of state and local operating budgets in the late 2000s, but has started to decline.

July 1 cash balances in school district flexible funds were about 6 percent of the combined general and supplemental general (or local option budget) fund budgets in 2006 through 2008, rose to around 10 percent in 2011 and 2012, and dropped back to 9 percent last year.

By comparison, the state of Kansas is supposed to have an ending balance of 7.5 percent in the State General Fund, although this requirement is frequently not followed. The ending balance acts as a kind of contingency reserve for the state, but in order to manage its own cash flow needs, the state each year has to borrow from other state funds using what are called “certificates of indebtedness.” However, these certificates must be repaid by the end of the fiscal year.

The combination of ending balance plus certificates of indebtedness has never been less than 12 percent of the state general fund since 2006, which means the state’s cash flow and contingency funds are higher as a percentage of budget than school district flexible funds for the same purpose.


The current projection for the state general fund is it will end the current fiscal year with a balance of $67 million, or 1.1 percent - assuming the Governor makes an additional $50 million in spending cuts. This means if revenues are just 1.1 percent below estimates, the state will face a revenue shortfall which could require cuts in spending, including school district state aid. Last year, state aid was reduced by $50 million in the middle of the year.

The choice local school boards face: whether their budget plans should reduce cash balances to avoid spending cuts now, or hold on to those balances in case the state makes additional reductions.

Tuesday, 21 July 2015

Why are school districts cutting budgets when total funding is up?

As school boards across Kansas adopt budgets for the upcoming year, the media is reporting two different situations.

School administrators in some districts have laid off staff and are cutting programs for students while nearly all districts are making tough choices.

But others, such as Gov. Sam Brownback and legislative leaders, are saying that school funding is at an all-time high, and the new block grant system, they say, was designed to protect districts from cuts and provide stability.

Many parents, patrons and even school board members are likely confused by these different perspectives. The facts are really fairly simple. Although total funding is up, the part of school funding available for day-to-day operating costs is not keeping up with inflation and enrollment.

  1. Operating funding per pupil has not kept pace with inflation since 2009 even though total funding per pupil is at an all-time high.

School funding falls into several big categories. The money school boards can use for general educational purposes, from paying teacher salaries to heating, cooling and lighting buildings to busing students, comes from general state aid, special education state aid, and a local option budget. These are state and local operating funds, and they represent about two-thirds of total funding.

The remaining third is made up of federal funding for education programs, food service costs (funded by both federal aid and student meal fees), state contributions to the Kansas Public Employees Retirement System, costs of buildings and equipment approved by district voters or from local capital outlay tax levies, and other student fees for textbooks, etc. By law, none of these funds can be used for “general” operating costs.

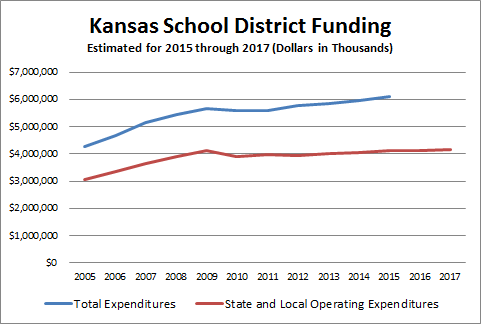
Total school district funding is, in fact, at an all-time high, expected to top $6.1 billion this year. Following the Montoy school finance decision by the Kansas Supreme Court in 2005, funding increased rapidly, then declined following the Great Recession before beginning a slower rate of increase.

However, state and local operating budgets, which include each school district’s general fund, state special education aid and local option budgets, took a bigger hit following the recession, and recovered much more slowly. In fact, state and local operating budgets for the school year that just ended were at the same level as in 2009, although inflation has increased nearly 10 percent.


(Dollars in Thousands)

Total Expenditures
State and Local Operating Expenditures
2005
$4,289,415
$3,061,172
2006
$4,689,295
$3,366,474
2007
$5,142,077
$3,644,340
2008
$5,446,453
$3,918,061
2009
$5,666,732
$4,114,725
2010
$5,589,549
$3,922,115
2011
$5,587,044
$3,967,882
2012
$5,771,010
$3,951,270
2013
$5,852,471
$4,024,580
2014
$5,975,518
$4,064,765
2015
$6,100,000
$4,113,740
2016

$4,164169
2017

$4,190607

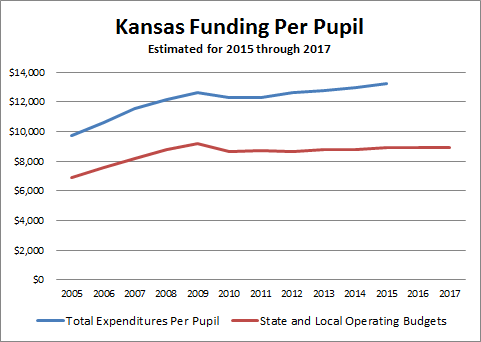
Total funding does not take into account changes in student enrollment, which has been increasing. Total Kansas per pupil spending is at its highest point ever, projected to be over $13,000 in 2015. However, state and local operating funds per pupil is still below the 2009 level.


Total Expenditures Per Pupil
State and Local Operating Budgets
2005
$9,707
$6,928
2006
$10,596
$7,607
2007
$11,558
$8,192
2008
$12,188
$8,768
2009
$12,660
$9,193
2010
$12,330
$8,652
2011
$12,283
$8,723
2012
$12,656
$8,665
2013
$12,781
$8,789
2014
$12,960
$8,816
2015
$13,246
$8,933
2016

$8,997
2017

$8,009

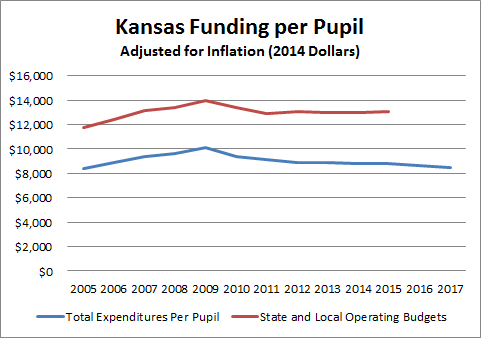
Finally, actual dollars do not show the impact of inflation. The following chart shows per pupil funding adjusted by the consumer price index to 2014 dollars. Total spending per pupil, when adjusted to 2014 dollars, is actually below 2007 levels. Operating dollars per pupil have actually declined when adjusted for inflation every year since 2009, and are projected to do so for the next two years under the block grants approved by the 2015 Legislature.

In short, Kansas school funding is like a family budget in which income may be increasing each year, but it has failed to keep pace with inflation and other extra costs. That family’s “real purchasing power” is actually dropping. Just like a family, when a school district’s expenses exceed income, the district must make cuts.


Inflation-Adjusted

State and Local Operating Budgets
Total Expenditures Per Pupil
2005
$8,388
$11,753
2006
$8,922
$12,428
2007
$9,342
$13,181
2008
$9,629
$13,385
2009
$10,132
$13,953
2010
$9,382
$13,370
2011
$9,170
$12,911
2012
$8,924
$13,034
2013
$8,921
$12,973
2014
$8,816
$12,960
2015
$8,827
$13,089
2016
$8,708
2017
$8,540

2. In the next two years, per pupil operating funding is projected to fall behind inflation under the block grant system.

The block grant bill passed by the 2015 Legislature basically did three things. First, it cut the state aid formula for local option budget and capital outlay state aid, so most districts did not receive as much funding as expected last year. This, in turn, required these districts to reduce their budgets during the year.

Second, it locked in most funding for school operating budgets for the next two years at the same level as the current year. In other words, it “froze” funding levels regardless of changes in student enrollment, special needs or inflation.

Third, it provided increased funding for KPERS pension contributions over the next two years - but districts can’t use these funds for any other purpose. KPERS aid is simply transferred to the district, then immediately transferred out.

When districts talk about budget cuts for the next two years under the block grants, it generally means they have rising fixed costs for salaries, insurance, utilities, and in many cases additional students. Because the block grant freezes operating funds, the district must find cuts in other parts of the budget to cover these additional expenses.

3. While total K-12 funding has increased over the past five years, most of the increase has not been available for regular educational operating costs.

School funding is not interchangeable. Districts have significant flexibility within some parts of their budget, and much less flexibility in others. Over the past five years, the flexible parts of school budgets have increased much less than restricted funding areas.

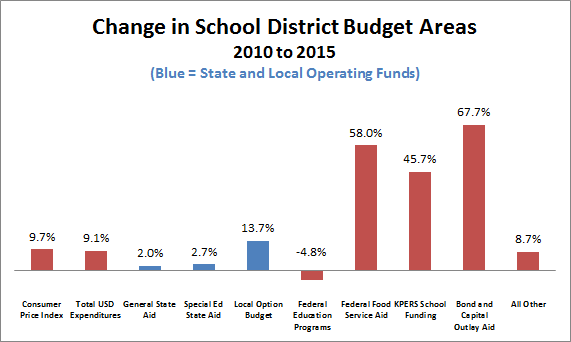
Since 2010, total funding for school districts increased by $510 million, but general operating funds from the state account for only $53 million, or about 10 percent of the total. Special education aid has barely changed. Local Option Budgets have increased by $127 million, or about one-quarter of the increase. The state legislature provided a large increase in LOB aid that took place last year (2015) to comply with a Supreme Court order. However, most of this increase had to be used to reduce local LOB mill levies, not to provide districts with additional spending power.

Over past five years, federal funding for education programs such Title I, special education federal aid and career and technical education aid has actually declined. However, federal meal support has increased due to the higher number of low income children. In fact, federal food aid accounted for more funding in the past five years than general state aid.

KPERS contributions for school employee retirement benefits increased by nearly $100 million, as the state has increased contributions to the underfunded pension system, but none of those dollars can be used for regular classroom expenses. In addition, state aid for bond payments and capital outlay expenditures - which can only be used for those purposes - increased nearly $90 million, because local voters have approved a number of school bond projects and the Legislature voted to restore capital outlay aid after another Supreme Court order.


Conclusion

It’s true that from the viewpoint of total dollars, funding for Kansas school districts is rising. However, the rate of increase is less than enrollment and inflation, especially for operating budgets, and the increased funds, such as pension obligations, are devoted to areas that cannot be used for classroom instruction. That means districts must cut positions, programs and services to cover expenses that are increasing faster than resources. This situation is projected to continue for the next two years under the block grant program.